
Webshare sells three proxy products and prices them in two different units. Rotating residential is billed per gigabyte, while proxy servers and static residential are billed per proxy per month. So the page cannot be compared to itself, let alone to a rival, until you pick a unit. Only one of the three converts honestly into a per-gigabyte figure, and that conversion is below. Every number was read from their pricing page on 9 September 2026.
We run a competing residential network, so weigh our reading accordingly. The ladders are theirs and the arithmetic is ours.
The short version
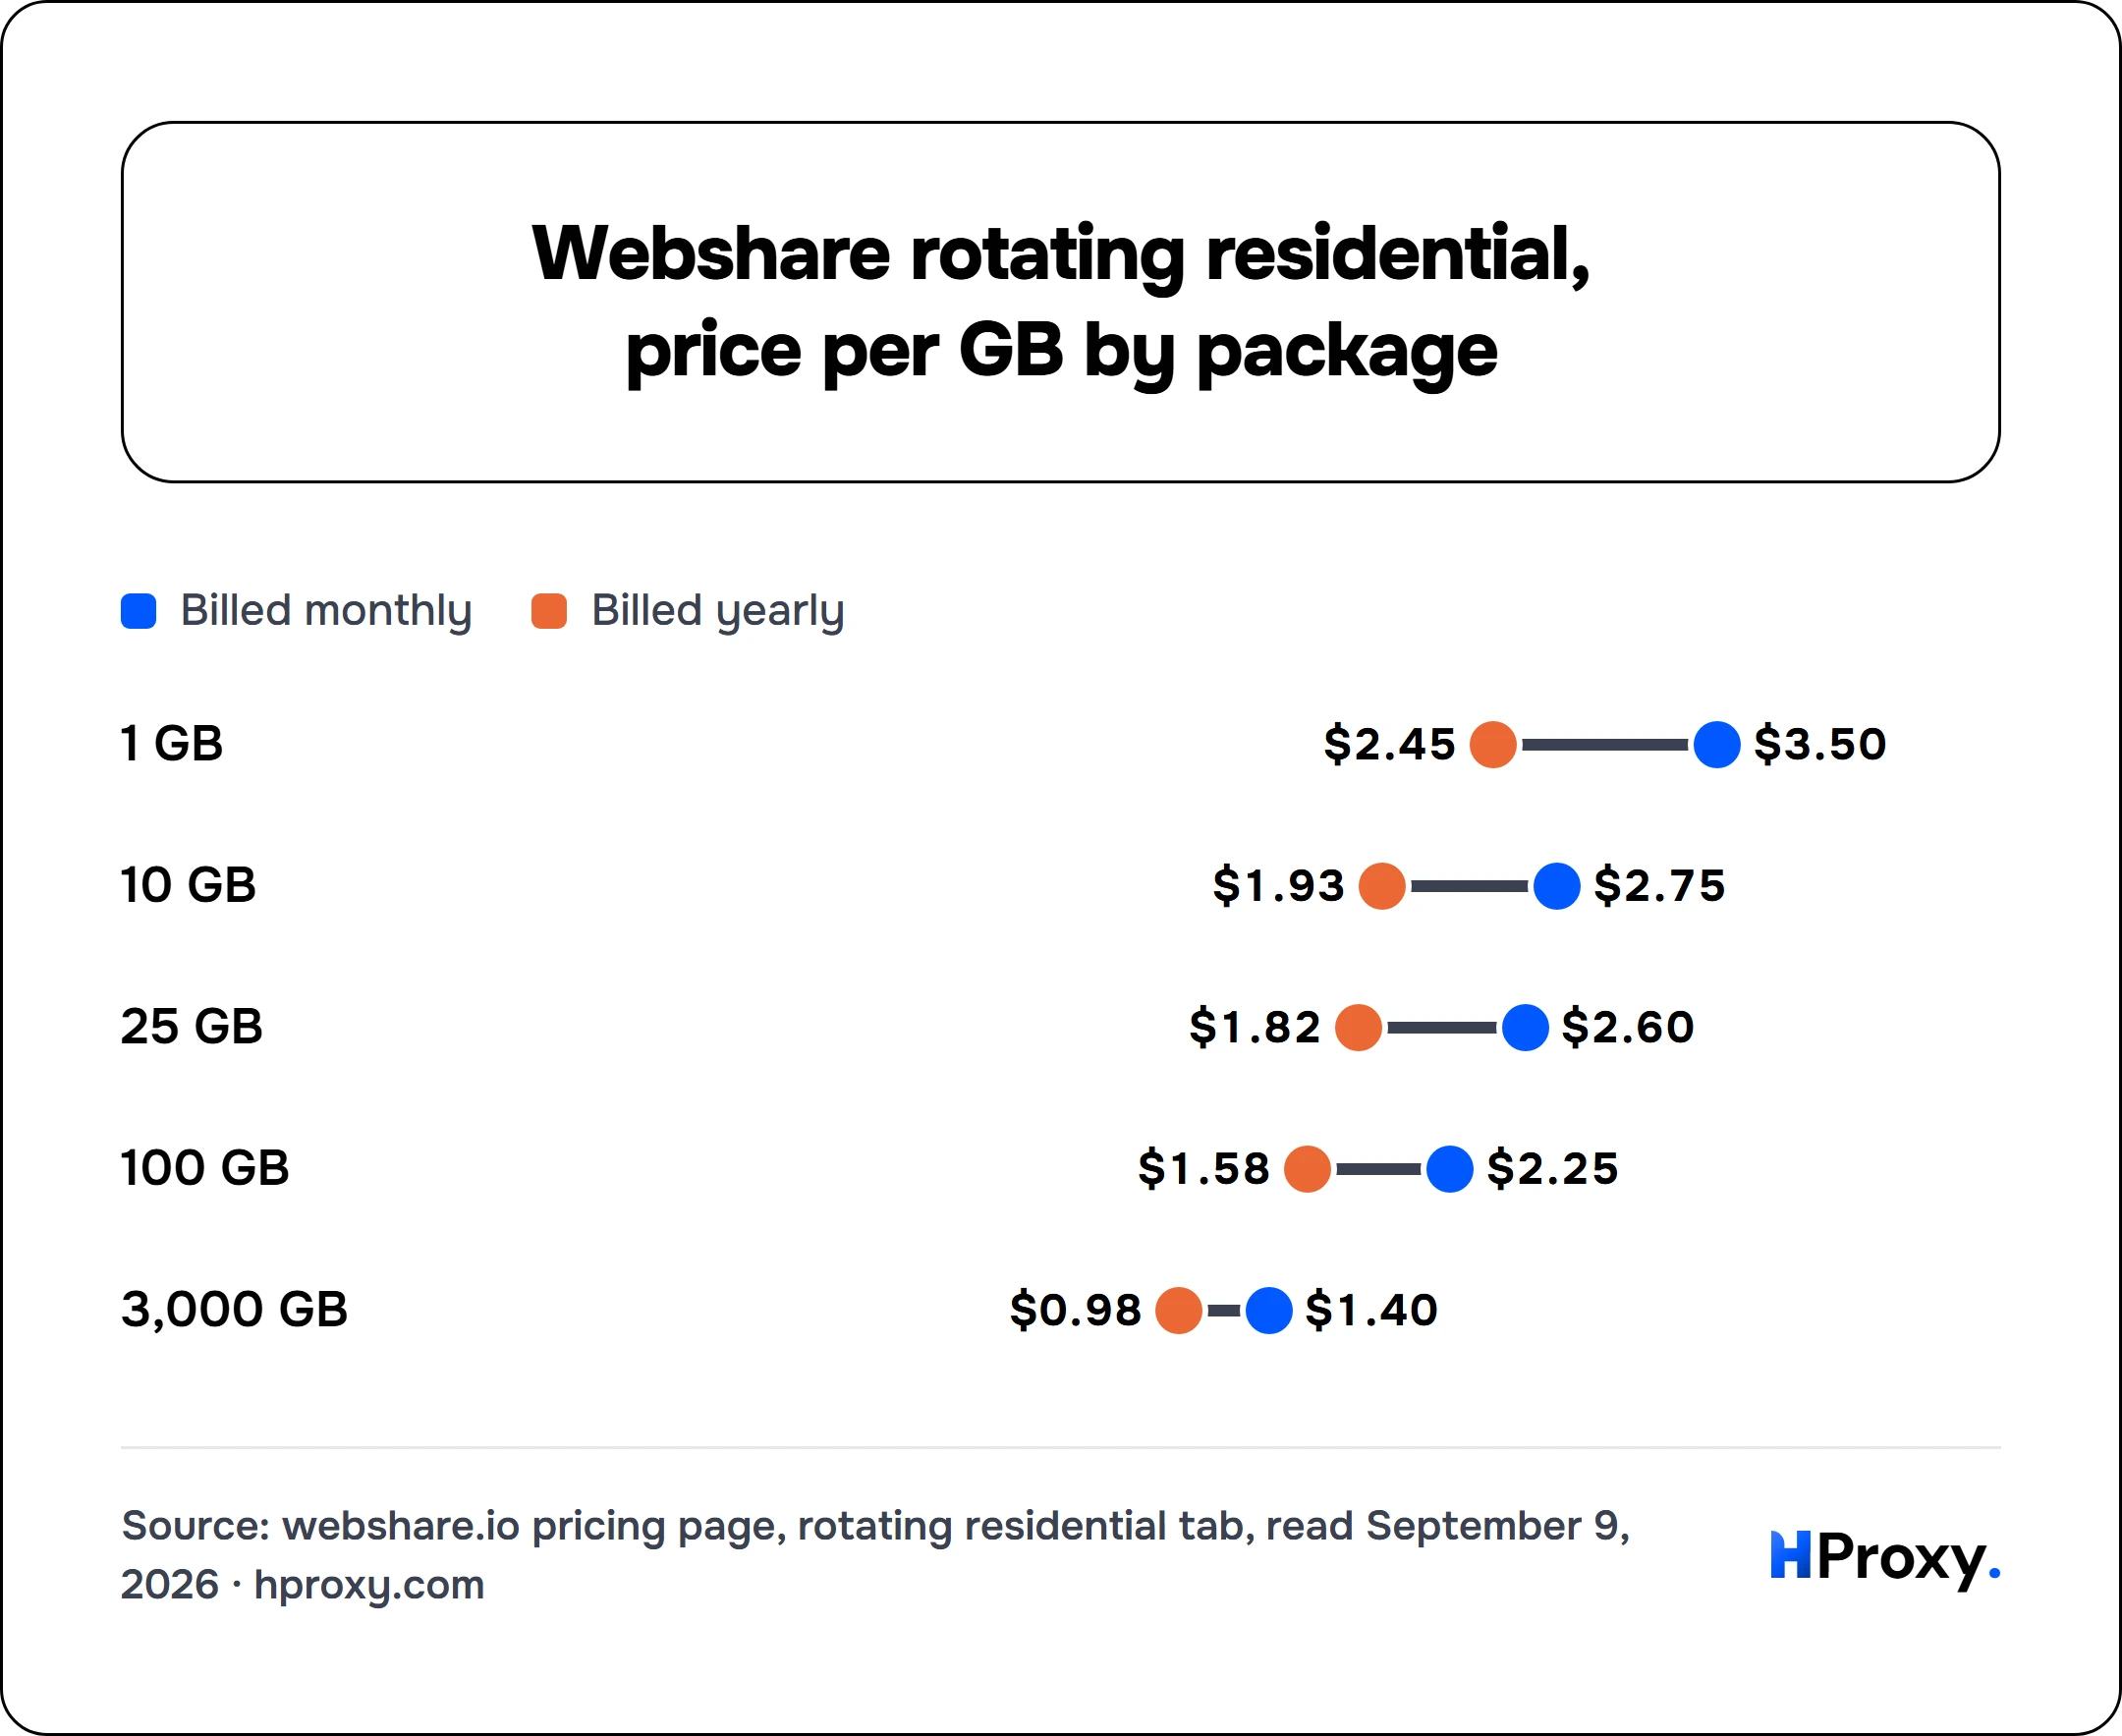
Rotating residential runs $3.50 per GB at one gigabyte down to $1.40 at three thousand, billed monthly. A struck-through $7.00 per GB sits beside every tier, including the cheapest, so nobody pays it. The yearly toggle advertises 30 percent, which holds on residential but not on the two per-proxy products, where the per-proxy figure and the monthly total disagree. The headline per-proxy rate is also one specific configuration with 250 GB of bandwidth.
What Webshare publishes
Three ladders, in the vendor's own units. The final column of each is our division, and it exists only where a division is meaningful.
Rotating residential, priced per gigabyte
| Bandwidth | List, per GB | Monthly, per GB | Yearly, per GB | Badge shown |
|---|---|---|---|---|
| 1 GB | $7.00 | $3.50 | $2.45 | SAVE 50% to 65% |
| 10 GB | $7.00 | $2.75 | $1.93 | SAVE 60% to 72% |
| 25 GB | $7.00 | $2.60 | $1.82 | SAVE 62% to 74% |
| 100 GB | $7.00 | $2.25 | $1.58 | SAVE 67% to 77% |
| 3,000 GB | $7.00 | $1.40 | $0.98 | SAVE 80% to 86% |
webshare.io pricing page, rotating residential tab, read 9 September 2026
- Billed monthly
- Billed yearly
Proxy servers and static residential, priced per proxy per month
| Quantity | Proxy server, monthly | Proxy server, yearly | Static residential, monthly | Static residential, yearly |
|---|---|---|---|---|
| 10 | free | free | not offered | not offered |
| 20 | not shown | not shown | $0.30 | $0.24 |
| 100 | $0.0299 | $0.0239 | $0.30 | $0.24 |
| 500 | not shown | not shown | $0.285 | $0.228 |
| 1,000 | $0.0269 | $0.0215 | $0.27 | $0.216 |
| 5,000 | $0.0239 | $0.0191 | not shown | not shown |
| 10,000 | not shown | not shown | $0.225 | $0.18 |
| 60,000 | $0.0179 | $0.0144 | not shown | not shown |
webshare.io pricing page, proxy server and static residential tabs, read 9 September 2026
The free tier sits at the bottom of the proxy server ladder. It gives ten proxies with no card, which is a datacenter product rather than a residential one.
The $7.00 that nobody pays
A struck-through $7.00 per GB appears beside every rotating residential tier. It appears beside the cheapest tier too, where the badge reads SAVE 50 percent.
So there is no advertised way to pay $7.00 per gigabyte. The lowest quantity on the ladder is already half of it.
A discount available on every purchase is simply the price, presented next to a larger number.
This shape is worth spotting on any pricing page, because it makes a rate feel like a win. The feeling arrives before you have compared it to anything. The useful habit is to ignore the struck-through column and read only what you would pay.
The yearly discount is three different numbers
The billing toggle advertises "save 30%". We checked that claim against the figures on all three tabs, and it holds on one.
On rotating residential it is exact. Monthly $3.50 becomes yearly $2.45, and monthly $2.25 becomes $1.58, both precisely 30 percent lower.
On the two per-proxy products the page shows two figures that do not agree with each other:
Yearly figures on the per-proxy products
| Tier | Monthly rate | Yearly per-proxy figure | Yearly monthly total | Total divided by count |
|---|---|---|---|---|
| Proxy server, 100 | $0.0299 | $0.0239 | $1.99 | $0.0199 |
| Proxy server, 5,000 | $0.0239 | $0.0191 | $79.77 | $0.0159 |
| Static residential, 20 | $0.30 | $0.24 | $4.00 | $0.20 |
| Static residential, 10,000 | $0.225 | $0.18 | $1,500.75 | $0.15 |
our own division of figures advertised on their pricing page, 9 September 2026
Read the last two columns against each other. The per-proxy figure is exactly 20 percent below the monthly rate on every row.
The monthly total is exactly one third below it on every row. Both patterns hold on every tier we checked, so this is not a rounding error.
We could not determine which of the two figures is actually charged. The badge and the total agree with each other, and the per-proxy label does not agree with either.
Anyone buying a yearly per-proxy plan should confirm the number at checkout before committing. We flag this as an observation about published figures, not as a claim about what the invoice says.
The badge stacks two different discounts
One more point about how it is shown, because it changes what a number means. On the yearly view, a badge reading SAVE 60 percent is not a yearly discount.
The struck-through figure beside it is that quantity at the base rate, with no volume discount. So the badge combines the volume discount you would get anyway with the term discount you chose.
At 60,000 proxies the monthly view already shows SAVE 40 percent, and that 40 percent is volume alone. The yearly step adds the rest.
Match the units before you compare
This is the part that matters more than any single rate. Three products, two units, and no way to compare them without a conversion you have to build yourself.
A per-proxy price answers how much an address costs to rent. A per-gigabyte price answers how much traffic costs to move. They measure different things.
Buying 100 shared proxy servers at $2.99 a month is not comparable to buying 1 GB of rotating residential at $3.50. One rents you addresses with a bandwidth cap, and the other sells traffic through a rotating pool.
The same trap sits between vendors. We have watched buyers hold a datacenter per-IP rate against a residential per-GB rate. They then conclude that residential is expensive, and the units did the arguing.
Our guide to reading a proxy pricing page works through the questions that expose this. The market's per-gigabyte rates sit together in the residential proxy price study.
The comparison, converted to one number
Rotating residential is the only Webshare product that converts cleanly, because both sides are already priced per gigabyte.
Cost per gigabyte of rotating residential
| Where you buy it | Published as | Per GB |
|---|---|---|
| Webshare, 1 GB, monthly | $3.50 per GB | $3.50 |
| Webshare, 100 GB, monthly | $225.00 per month | $2.25 |
| Webshare, 3,000 GB, monthly | $4,200.00 per month | $1.40 |
| Webshare, 1 GB, yearly | $2.45 per GB | $2.45 |
| Webshare, 3,000 GB, yearly | $2,940.00 per month | $0.98 |
| HProxy residential, one gigabyte | flat, no plan | $0.50/GB |
| HProxy residential, volume floor | at 2,000 GB+ | $0.44/GB |
vendor pricing page and our own live price list, 9 September 2026
Our rate is flat from the first gigabyte, drawn from a balance rather than a plan. That shape is the real difference here, not the headline number. Price is also not pool quality, and no table settles which network works on your target.
What is metered on top
The advertised per-proxy price is one specific configuration, and the checkout link encodes it. Bandwidth is set to 250 GB, sub-users to three, and proxy replacements to ten.
Four upgrades are switched off in that same link. They cover unlimited IP authorisations, high concurrency, a high priority network, and doubling the proxy count.
Each of those is a paid switch that moves the price away from the headline. The proxy server panel confirms the range, listing bandwidth from 250 GB to unlimited and threads from 500 to 3,000.
We could not price any of those upgrades. The express checkout that would show them returned a CAPTCHA, and we stopped there.
That leaves a real gap in this teardown, and it is the most important one. A per-proxy rate with a bandwidth cap is incomplete until you know what the cap costs.
Who this pricing suits
Webshare suits buyers who want many cheap datacenter addresses and know their bandwidth stays inside the allowance. At around three cents per proxy per month, that ladder is genuinely aggressive.
It suits static residential buyers who count addresses rather than traffic. Thirty cents per ISP proxy per month is a clear number, and the ladder is published.
It suits per-gigabyte residential buyers less well. The entry rate is $3.50 per GB, and reaching $1.40 requires three thousand gigabytes a month.
It also suits anyone comparing carelessly rather badly, and that is not the vendor's fault. Three products in two units will mislead anyone who reads only the smallest number.
What we could not verify
We could not price the four paid upgrades encoded in the checkout link. That page returned a CAPTCHA challenge, and we stopped rather than working around it.
We could not confirm what happens when a proxy server plan exceeds its 250 GB bandwidth allowance. The panel gives a range up to unlimited without publishing the steps between.
We found no statement about whether unused residential bandwidth rolls over or expires. On a per-gigabyte subscription that term decides the effective rate.
We could not reconcile the two yearly figures on the per-proxy products, as set out above. We report both exactly as displayed and make no claim about which is charged.
Prices move, and configurator pages move quietly. Every figure here was read on 9 September 2026, so check the live page before committing.
Sources
- Webshare, pricing page, rotating residential tab, read 9 September 2026. The per-gigabyte ladder at monthly and yearly billing, the struck-through $7.00 list price, and the discount badges.
- Webshare, pricing page, proxy server tab, read 9 September 2026. The per-proxy ladder from 100 to 60,000 proxies at both billing periods, and the free ten-proxy tier.
- Webshare, pricing page, static residential tab, read 9 September 2026. The per-proxy ladder from 20 to 10,000 proxies at both billing periods.
- Webshare, pricing page, proxy server panel, read 9 September 2026. Bandwidth stated as 250 GB to unlimited and threads as 500 to 3,000.
- Webshare, pricing page checkout links, read 9 September 2026. The configuration behind each advertised tier, including the bandwidth, sub-user and replacement defaults and the four upgrade switches.
- Our own arithmetic on those published figures, 9 September 2026, shown in every table above.